I've been learning about Drupal Module Development the past few weeks. I'm using the venerable "Definitive Guide to Drupal 7" and a few times in the module development chapters (18, 19, 20), author Ben Melançon mentions running Drupal "in an IDE" to see how Drupal creates its various internal arrays.
I know an IDE: I know Eclipse! As a Java developer, any day where I'm inside Eclipse, I know I'm "doing development". I've known about Eclipse's abilities to handle other languages (C++, Perl, etc.), so I set about trying to get Eclipse to help me with development in PHP.
I'm running Windows XP. I have a hand-built WAMP stack composed of Apache 2.2, MySQL 5.1, and PHP 5.2.9-1 (VC6 x86 Thread Safe). After an initial perusal of d-dot-o, I found an entry about Eclipse debugging. That post features a comment by jstrauss64, which pointed me to XDebug.
Rather than using my old creaky Eclipse filled with Java add-ons, I decided to get an "all-in-one" Eclipse, containing both Zend and the PHP Developers Tools (PDT). This would save me some time from having to install these add-ons by hand into Eclipse.
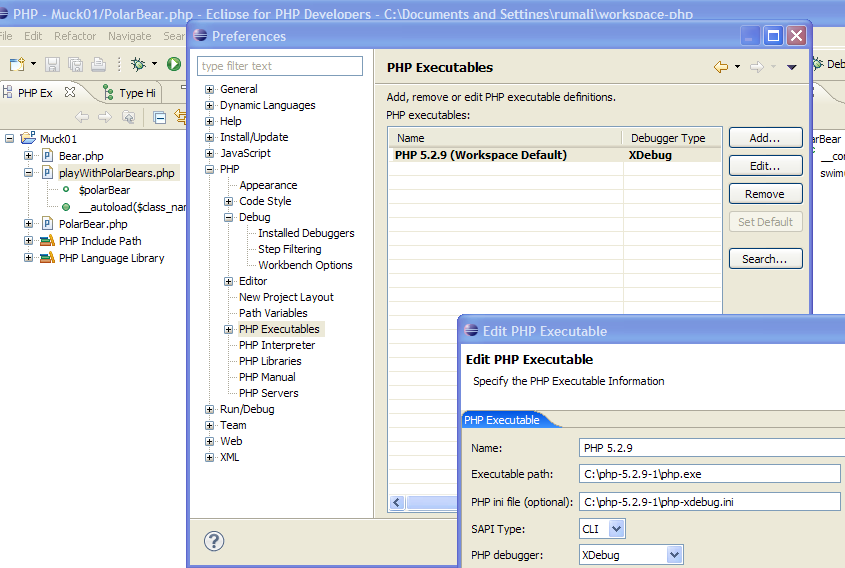
After I installed this Eclipse into its own directory, I downloaded XDebug. It has a web page which offers tailored installation instructions, based on the output of phpinfo(). The tailored instructions had me downloading php_xdebug-2.1.2-5.2-vc6.dll, copying it into my PHP's ext subdirectory, and then editing my php.ini file. The "php -m" command showed that I installed the module correctly, and a restart of my Apache showed that I now had XDebug available. I then configured my Eclipse to point to my PHP, using Preferences (in the Window menu):
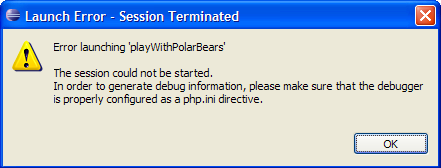
I took a small PHP program (composed over three files), and loaded it up into Eclipse. When I tried to run it, I got an error: "Error launching 'program'. The session could not be started. In order to generate debug information, please make sure that the debugger is properly configured as a php.ini directive."
I also noticed that I couldn't run the PHP program as a CLI. Eclipse only offered "PHP Web Application" as the way to run this program. This error was nasty. Searching on the Internet produced lots of hits but nothing immediate. I did try various php.ini settings, enough so that I created a separate INI file named php-xdebug.ini. This file's differences between php.ini were:
- output_buffering = 0
- implicit_flush = On
- [xdebug]
- xdebug.remote_enable=1
- xdebug.remote_host="localhost"
- xdebug.remote_port=9000
- xdebug.remote_handler="dbgp"
- xdebug.remote_log=c:\eclipse-php\xdebug.log
- zend_extension_ts = .\ext\php_xdebug-2.1.2-5.2-vc6.dll
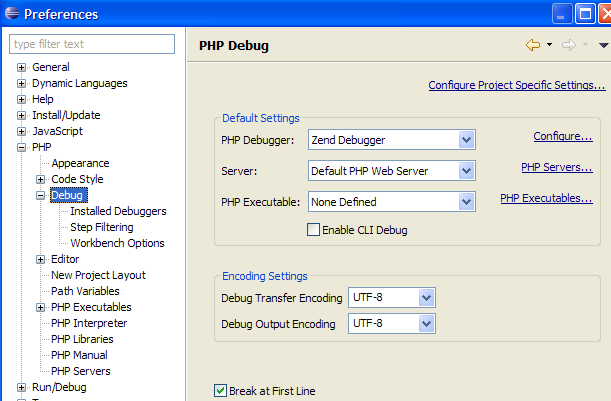
Nothing seemed to be making a difference. I stared long and hard at my Eclipse's "preferences" for PHP Debugging, and eventually noticed that it was set to Zend!
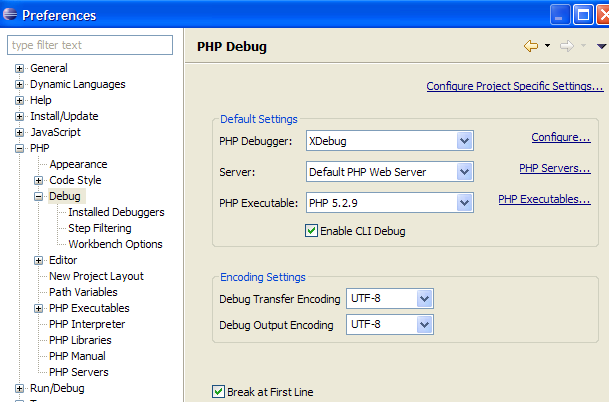
How could I have missed this? I blame the fact that the PHP Preferences separate "Debug" settings from "PHP Executables" settings. I changed the Debug settings to XDebug. I also "enabled" the "Enable CLI Debug" toggle.
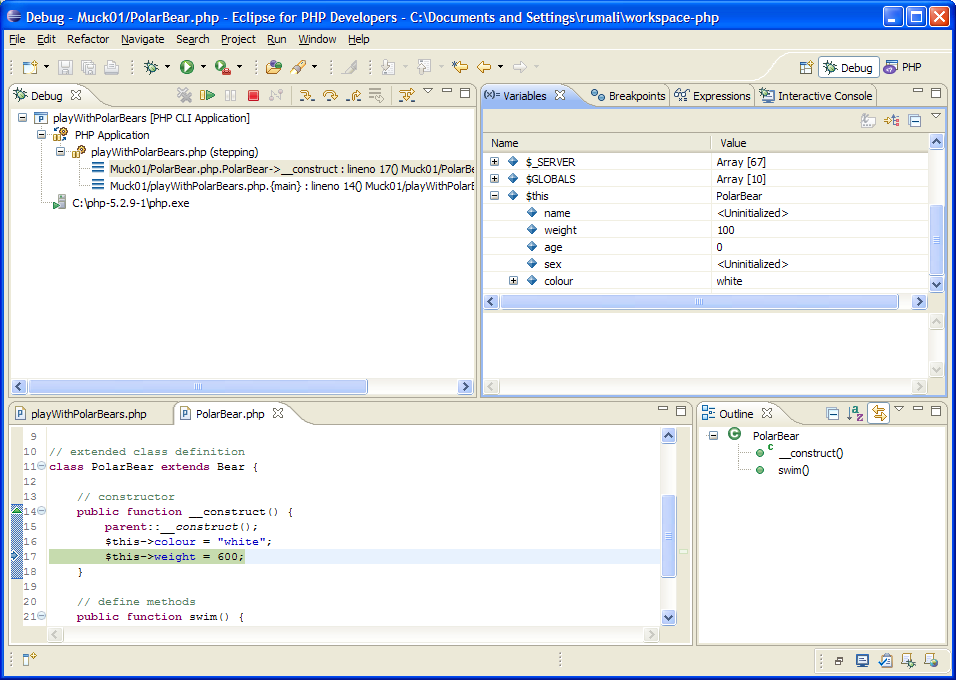
When things didn't work even after this change, I hit "Clean..." from the Eclipse's Project menu. (This is an old habit from Java.) That made things work! I was able to run this simple PHP program, and also hit breakpoints and examine variables.
 I haven't tried to load in all of Drupal into Eclipse yet, nor have I tried to debug a PHP Web Application, but I'm sure solving this puts me on the track.